Posts

Banknifty Pivot Point

Image
  Banknifty Pivot Point The Banknifty Pivot Point is a technical indicator that can be used to identify potential support and resistance levels for the Banknifty index. It is calculated by taking the average of the previous day's high, low, and close. The pivot point is marked as a horizontal line on the chart. The support and resistance levels are calculated by adding or subtracting a percentage of the pivot point from the pivot point. The most common percentage used is 10%, but other percentages can be used as well. In the chart above, the pivot point is 47,661.70. The support levels are 47,524.60, 47,344.30, and 47,207.20. The resistance levels are 47,842.05, 47,979.10, and 48,159.45. If the Banknifty index breaks below the S1 level, it could indicate that there is selling pressure and that the index could fall further. Conversely, if the index breaks above the R1 level, it could indicate that there is buying pressure and that the index could rise further. Of course, pivot point...
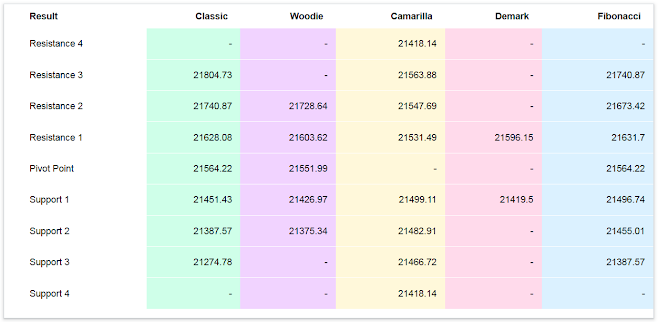
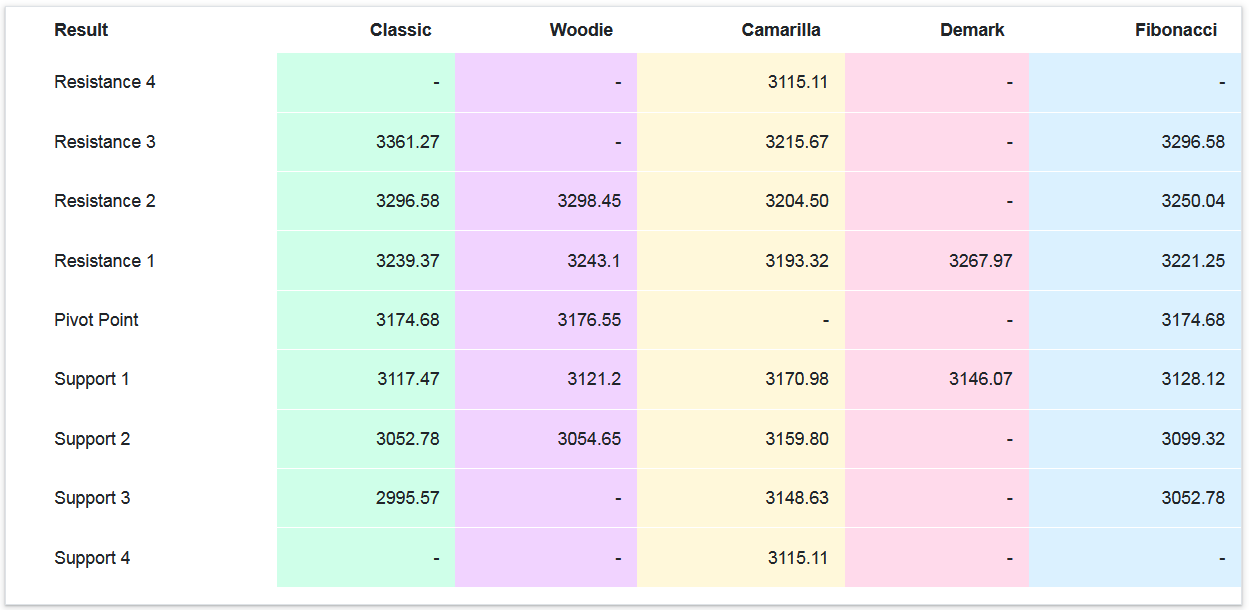
Nifty Pivot Point Calculator

Image
Nifty Pivot Point Calculator Nifty Pivot Point Calculator A Nifty Pivot Point Calculator is a tool used by traders in the Indian stock market to predict potential support and resistance levels for the Nifty 50 index, a benchmark index that tracks the performance of the 50 largest and most liquid companies listed on the National Stock Exchange of India (NSE). Here's how it works: Input previous day's data: The calculator requires you to enter the previous day's high, low, and closing prices for the Nifty 50 index. Choose a pivot point calculation method: There are different formulas used to calculate pivot points, each with its own strengths and weaknesses. Some popular methods include Classic, Woodie's, Camarilla, and DeMark's. The calculator should allow you to choose the method you prefer. Calculate pivot points: Once you've entered the data and chosen a method, the calculator will automatically calculate the pivot point, along with several support and resista...

MCX Pivot Point

Image
 MCX Pivot Point MCX Pivot Points are technical analysis levels used by traders to identify potential support and resistance zones in the market. They are calculated based on the previous day's trading range (high, low, and closing price) and can be used to: Gauge the overall market sentiment (bullish or bearish) Identify potential entry and exit points for trades Set stop-loss and take-profit orders There are different types of pivot points, but the most common ones are: Pivot Point (PP): The average of the previous day's high, low, and closing price. Support levels (S1, S2, S3): Levels below the pivot point that are calculated using different formulas. They are potential areas where the price may bounce back if it falls. Resistance levels (R1, R2, R3): Levels above the pivot point that are calculated using different formulas. They are potential areas where the price may stall or reverse if it rises. Here is an example of MCX Pivot Points: As you can see, the pivot point is in...

NR7 screener

Image
NR7 screener The NR7 screener is a technical analysis tool that helps traders identify stocks that have been trading in a narrow range for the past seven days. These stocks are potential breakout candidates, meaning that they may be poised for a sharp move higher or lower. The NR7 screener displays a list of stocks, along with their symbol, last traded price (LTP), open interest (OI), NR9, NR7, and NR4 values. The NR9, NR7, and NR4 values represent the highest and lowest prices of the stock over the past 9, 7, and 4 days, respectively. To use the NR7 screener, you can set filters based on the NR9, NR7, and NR4 values. For example, you might want to screen for stocks that have been trading in a narrow range for the past seven days but have also recently broken above their NR7 high. The NR7 screener can be a useful tool for identifying potential breakout stocks. However, it is important to remember that no technical indicator is foolproof. Always do your own research before making any in...

Nifty Pivot Point

Image
  Nifty Pivot Point NIFTY pivot points are calculated based on the previous day's trading range. They are used by traders to identify potential support and resistance levels for the current day's trading. There are four main pivot points: Pivot point (P): This is the average of the previous day's high, low, and closing prices. First support (S1): This is calculated as P - (H - L), where H is the previous day's high and L is the previous day's low. First resistance (R1): This is calculated as P + (H - L). Second support (S2): This is calculated as P - 2(H - L). Second resistance (R2): This is calculated as P + 2(H - L). Traders can use pivot points to: Identify potential entry and exit points for trades. Set stop-loss orders to limit their losses. Take profits when the market reaches a pivot point. It is important to note that pivot points are not foolproof. They are simply a tool that can be used to help traders make informed decisions. Other...

Tata Motors Pivot Point

Image
  Tata Motors Pivot Point Tata Motors Pivot Point There are a few different pivot points for Tata Motors, depending on the calculation method used. Here are the most common ones: Standard pivot point: This is the most basic type of pivot point, and it is calculated using the previous day's close, high, and low prices. The pivot point is the average of these three prices. For Tata Motors, the standard pivot point on January 2nd, 2024, was ₹789.13. Fibonacci pivot points: These pivot points are calculated using a series of Fibonacci ratios. The first pivot point is the previous day's close, and the other pivot points are calculated by multiplying the previous day's range (high minus low) by certain Fibonacci ratios. For Tata Motors, the Fibonacci pivot points on January 2nd, 2024, were ₹764.13, ₹749.26, and ₹734.39.  Camarilla pivot points: These pivot points are similar to Fibonacci pivot points, but they use a different set of ratios. The Camarilla pivot points are also mor...