Nifty Pivot Points
Nifty Pivot Points
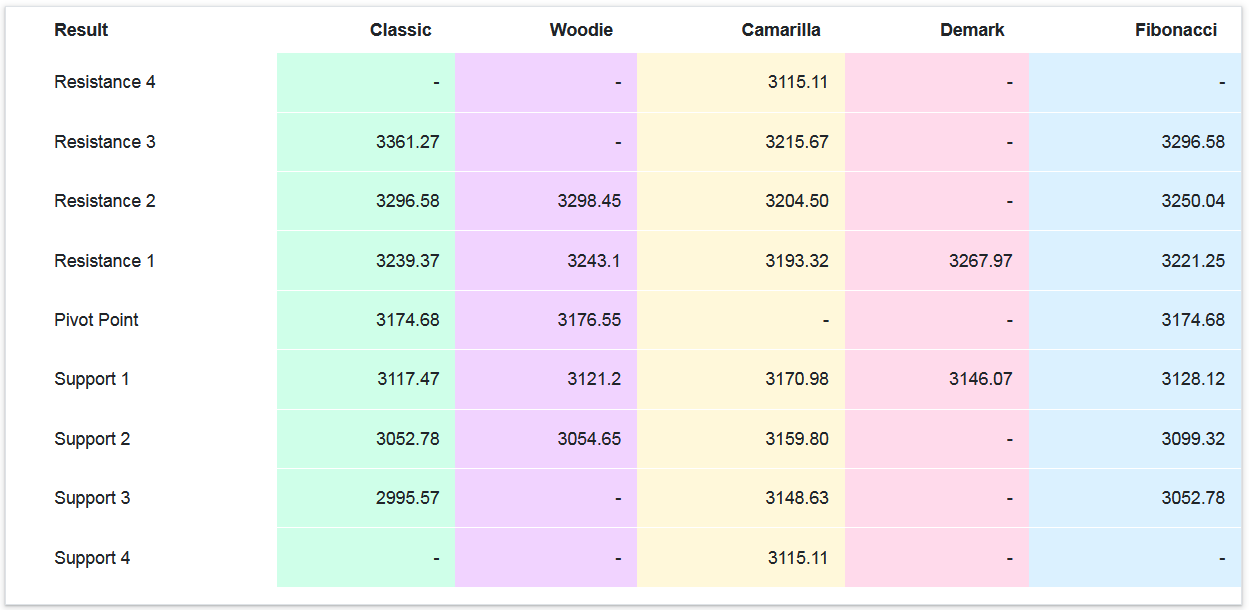
Nifty pivot points are support and resistance levels calculated based on the previous trading day's high, low, and closing prices. They are used by traders to identify potential entry and exit points for trades.
There are different types of pivot points, but the most common are classic pivot points, Fibonacci pivot points, and Camarilla pivot points.
Classic pivot points are calculated using the following formulas:
- Pivot point = (Previous day's high + Previous day's low + Previous day's close) / 3
- Support levels: S1 = Pivot point - (Pivot point - Previous day's low)
- S2 = Pivot point - 2 * (Pivot point - Previous day's low)
- S3 = Pivot point - 3 * (Pivot point - Previous day's low)
- Resistance levels: R1 = Pivot point + (Pivot point - Previous day's high)
- R2 = Pivot point + 2 * (Pivot point - Previous day's high)
- R3 = Pivot point + 3 * (Pivot point - Previous day's high)

- Fibonacci pivot points are calculated using the Fibonacci retracement levels of the previous day's trading range. The most common Fibonacci levels used are 38.2%, 50%, and 61.8%.
Camarilla pivot points are a more complex type of pivot point that takes into account the volatility of the market. They are calculated using a series of formulas that are beyond the scope of this article.
Pivot points are not perfect indicators, and they should not be used as the sole basis for making trading decisions. However, they can be a useful tool for identifying potential trading opportunities.
Here are some additional things to keep in mind when using pivot points:
- Pivot points are most effective in trending markets.
- The higher the volatility, the less reliable pivot points will be.
- Pivot points should be used in conjunction with other technical analysis tools.


Comments
Post a Comment